NIOS Free Solved Assignment [TMA] 2022 – 2023
Economics 318 Free Solved Assignment [TMA] 2022 – 23
Tutor Marked Assignment
Max. Marks: 20
In this article, you will get Economics 318 Free Solved Assignment [TMA] 2022-23. You will solved assignment of other subjects in our page nios solved assignment 202-23.

Note:
(i) All questions are compulsory. The marks allotted for each question are given beside the questions.
(ii) Write your name, enrollment numbers, AI name, and subject on the top of the first page of the answer sheet.
1. Answer any one of the following questions in about 40-60 words. 2
a) “Indian economy is known as developing economy on the map of world economy”. Suggest some effective measures to make our economy as a developed economy. (See Lesson-1)
Ans: Indian economy is known as developing economy on the map of world economy. But to make our country we have to take several steps:
1. Reducing poverty and increasing GDP by modernizing our agricultural system.
2. Encourage Foreign investment in various sectors of the economy especially banking and financial sector.
3. Encourage innovation and entrepreneurship through various EDP programmes. It can create many jobs in our country and reduces the problem of unemployment.
4. Reducing social and economical inequalities.
b) After independence the strategy of industrialization was implemented in order to address the problem related to poverty, unemployment, economic growth, self –reliance, etc. In the light of the statement list four strategies to solve these problems during planning period. (See Lesson-2)
Ans: Answer any one
2. Answer any one of the following questions in about 40-60 words. 2
a) Primary data is the one, which is collected by the investigator himself for a specific inquiry or study. As you know there are many ways to collect primary data. Based the above statement, list out methods of collecting data and explain any of them. (See Lesson-6)
Ans: Methods of Collecting Primary Data: Following are the important methods of collecting primary data:
(a) Observation Method.
(i) Structured and Unstructured Observation.
(ii) Participant and Non-Participant Observations.
(iii) Controlled and Uncontrolled Observations.
(b) Interview Method.
(i) Personal Interview.
(ii) Telephone Interview.
(c) Questionnaire Method.
(d) Schedule Method.
Questionnaire Method: In this method a list of questions pertaining to the survey is prepared and sent to the various informants by post. The questionnaire contains questions and provides space for answers. A request is made to the informants through a covering letter to fill up the questionnaire and send it back within a specified time. This method is adapted by private individuals, research workers, private and public organisations and even by govt.
b) The following are the marks (out of 100) of 60 students in mathematics: (See Lesson-6)
55, 26, 95, 31, 07, 78, 92, 62, 52, 56, 15, 63, 25, 36, 54, 44, 47, 27, 72, 16,
13, 5, 80, 86, 07, 51, 48, 24, 56, 70, 19, 61, 17, 16, 36, 34, 42, 34, 35, 72,
55, 75, 31, 52, 28, 72, 97, 74, 45, 62, 68, 86, 35, 85, 36, 81, 75, 04, 24, 30.
Construct a grouped frequency distribution table with a width 10 of each class.
Ans: Answer any one
3. Answer any one of the following questions in about 40-60 words. 2
a) Make a brief description of some effective programmers, and policies introduced by the government to reduce the extent of poverty, and unemployment from our country at the beginning of 21st century. (See Lesson-4)
Ans: Poverty refers to a state in which an individual is unable to fulfill even the basic necessities of life.
Unemployment: It means when a person is ready and willing to work at the prevailing rate of wage but does not get work.
Some of the policies introduced by the government to reduce the extent of poverty, and unemployment from our country at the beginning of 21st century:
1. Prime minister’s Rozgar Yojana (PMRY).
2. Swarna Jayanthi Shahri Rozgar Yojana (SJSRY).
3. Swarna Jayanthi Gram Swarozgar Yojana (SGSY).
4. Sampoorna Grameen Rozgar Yojana (SGRY).
5. National Rural Employment Guarantee Act 2005.
6. Pradhan Mantri Gramodaya Yojana (PMGY).
7. Atal Pension Yojana.
8. Pradhan Mantri Jan Dhan Yojana.
9. Ayushman Bharat Yojana.
10. Pradhan Mantri Mudra Yojana (PMMY).
b) “Excessive use of resources has given birth to the concept of sustainable development”. Justify the statement with a suitable illustration. (See Lesson-3)
Ans: Answer any one
4. Answer any one of the following questions in about 100-150 words. Word limit is not applicable for numerical questions.
(a) Construct a frequency polygon and histogram from the data given below; (See Lesson-6)
|
Marks: |
0-10 |
10-20 |
20-30 |
30-40 |
40-50 |
50-60 |
60-70 |
|
No. of Students: |
3 |
10 |
15 |
20 |
12 |
8 |
5 |
Ans: Answer any one
b) Suppose you are a student of class XII of a co-educational senior secondary school. You will get the board exam from the Faculty of Science, Arts, and Commerce, for the display board of the school. The duty is assigned to prepare a tabular presentation of the passing students. List the factors that you will keep in mind while preparing a tabular presentation, and also prepare a sample table. (See Lesson-7)
Ans: I am a student of class 12. This year I am going to appear in final exam. All the streams are studied in our school. I have been assigned a duty to present the percentage of passing students in tabular form. But while preparing table, there are many factors which is required to be kept in mind.
Key points to be taken into consideration while preparing table:
Tabulation refers to the systematic arrangement of the information in rows and columns. Rows are the horizontal arrangement. In simple words, tabulation is a layout of figures in rectangular form with appropriate headings to explain different rows and columns. The main purpose of the table is to simplify the presentation and to facilitate comparisons.
The following points to be taken into consideration while preparing table:
(i) To make complex data simple: When data are arranged systematically in a table, such data become more meaningful and can be easily understood.
(ii) To facilitate comparison: When different data sets are presented in tables it becomes possible to compare them.
(iii) To economize space: A statistical table furnishes maximum information relating to the study in minimum space.
(iv) To make data fit for analysis and interpretation.
(v) To provide reference: A statistical table can be used as a source of reference for other studies of similar nature.
Sample table is given below
|
Stream |
Number of students |
Number of passes |
Pass percentage |
|
Arts |
120 |
96 |
80% |
|
Science |
100 |
65 |
65% |
|
Commerce |
80 |
64 |
80% |
|
Total |
300 |
225 |
75% |
5. Answer any one of the following question in about 100 to 150 words. Word limit is not applicable for numerical question.
a) “All macroeconomic studies can help in better understanding, and analysis of micro economic variables. The study of the two branches differs in one way or the other, which also provides an important basis for understanding the concept of economics”. Explain the following concepts on the basis of the statement:
(i) Interdependence of micro, and macroeconomics with suitable illustration.
(ii) Differences between micro, and macroeconomics.
(iii) Significance of micro, and macroeconomics. (See Lesson-12)
(i) Interdependence of Microeconomics and Macroeconomics
Both Microeconomics and Macroeconomics are interdependent. Microeconomics is not always restricted to individual units and also Macroeconomics deals with aggregate at smaller level. The interdependence between the two can be studied in the following ways:
1. Microeconomics Depends on Macroeconomics: Micro-variables depend on behaviour of macro-variables i.e., decisions at micro level depend on decision taken at macro level. For example, Increase in overall tax rate would influence an individual decision to buy a T.V. set as its price goes up.
2. Macroeconomics depends on Microeconomics: Macro-variables depend on micro-economic variables i.e., decisions at macro level depend on decision at micro level. For example, Aggregate demand depends on the demand of individual households of the economy.
(ii) Difference between Micro and Macroeconomics:
a) Micro economics studies individual economic units whereas macroeconomics is concerned with economy as a whole.
b) The word micro has been derived from the Greek word micros which means small. On the other hand, macroeconomics is also derived from the Greek word macros which means large.
c) Micro economics was developed by classical and neo-classical economist Adam Smith and Alfred Marshall. Macroeconomics was developed by modern economist J.M. Keynes.
d) Micro economics is known as Price theory because it helps in determination of price on the basis of individual demand and supply. Macroeconomics is known as aggregate theory because it helps in determination of income and employment with help of aggregate demand and supply.
e) Microeconomics is concerned with allocation of resources whereas macroeconomics is concerned with the full utilization of resources.
(iii) Importance of Macroeconomics
Prof. J.K. Mehta feels that so long as men live in society, the economist cannot afford to neglect the study of macro-economy. The theoretical and the practical importance of macroeconomics would be clear from the following arguments:
1. Functioning of an Economy: Macroeconomic analysis is a paramount importance in getting us an idea of the functioning of an economic system. It is very essential for a proper and accurate knowledge of the behaviour pattern of the aggregative variables, as the description of a large and complex economic system is impossible in terms of numerous individual items.
2. Formulation of Economic Policies: Macroeconomics is a great help in the formulation of economic policies. The days of ‘Iaissez faire’ are over and government intervention in economic matters is an accomplished fact. Governments deals not with individuals but with groups and masses of individuals, thereby establishing the importance of macroeconomic studies.
3. Understanding Microeconomics: The study of macroeconomics is essential for the proper understanding of microeconomics. No micro economic law could be framed without a prior study of the aggregates; for example, the theory of individual firm could not have been formulated with reference to the behaviour pattern of one single firm, howsoever representative it might have been; the theory was possible only after the behaviour pattern of several firms had been examined and analysed.
b) Raj Pandey spends some part of his income on the purchase of apples and oranges. He buys different combinations of apples and oranges to achieve the same level of satisfaction. He knows the price of apples and oranges. He decides logically to buy different combinations of fruits according to the total amount, and price. Explain the following based on the above given information
1) Prepare imaginary schedule for indifference curve.
2) Graphical presentation for indifference curve.
3) Concept of Marginal Rate of substitution.
4) Properties of Indifference curve (See Lesson-14)
Ans: Answer any one
6. Prepare any one project out of the given below.
a) Visit any manufacturing unit in your area. Collect information related to the production process of the unit. Prepare project work on “Return to Factor” which is an important law of production, and makes it one of the important components of economic study. Include the following topics in the project as a result of the factor
(i) Factors of production to utilized.
(ii) Variable factors.
(iii) Fixed factors.
(iv) Total/Average/Marginal productivity.
(v) Graphical presentation of law of variable proportion, and stages of production.
(vi) Stage to be preferred by manufacturer to produce goods, and services.
After completion of the project prepare five questions based on the project for better understanding. (See Lesson-17)
Ans: Answer any one
b) The prices of goods in the market are made on the basis of various forms of the market, its structures, graphs. The major topics you can cover in the project are the following:
(i) Types of market with its features.
(ii) Perfect competition, and price determination.
(iii) Application in the determination of floor price, and support price of commodities.
After completion of the project, prepare five questions based on the project for better understanding. (See Lesson-23)
Ans: (i) Types of Market and their features
Perfect Competition Meaning
Perfect Competition is a form of market in which there is a large number of buyers and sellers. They sell homogeneous goods. Firm produces only a small portion of the total output produced by the whole industry.
An industry is a group of different firms producing the same product. A single firm cannot affect the price by its individual efforts. Price is fixed by the industry. Firm is only a price taker and not a price-maker. It can sell the desired output only at the price-fixed by the industry. In such a market, price of the commodity is the same at every place.
There is also free entry and exit of the firms. Both the buyers and sellers have perfect information about the prevailing price in the market. Thus perfect competition is the name given to a market in which buyers and sellers compete with one another in the purchase and sale of a commodity.
Features of Perfect Competition:
– There is large number of buyers and sellers.
– Products are homogenous.
– Freedom of entry or exit in perfect competition.
– Demand is perfectly elastic.
– Firms are Price taker in perfectly competitive market.
Monopoly Market Meaning
Monopoly market is one in which there is only one seller of the product having no close substitutes to the commodities sold by the seller. The seller has full control over the supply of that commodity and also he is the price maker. There being only one firm, producing that product, there is no difference between the firm and industry in case of monopoly. Monopoly is a price maker not the price taker as in the case of perfect competition. Its demand curve slopes downward to the right.
Features of Monopoly:
– There exists only one seller.
– In monopoly, there is absence of competition.
– Monopoly may sell homogenous and differentiated products.
– Entry of new firms in the market is restricted.
– Demand is inelastic.
– Monopolist is price maker.
Monopolistic Competition Meaning
Monopolistic competition, as the name itself implies, is a blend of monopoly and perfect competition. It refers to the market situation in which many producers produce and sell goods which are closely related to each other and close substitutes but they are not identical. In this respect each firm will have some monopoly at the same time the firm has to compete in the market will other firms as they produce close substitutes. Also they are large number of sellers who follow an independent price policy.
Features of Monopolistic Competition
– There is large number of buyers and sellers.
– Competition amongst monopolists.
– Products are different but close substitute of one another.
– Freedom of entry or exit of firms into the market.
– Prices are competitive in monopolistic competition.
– Selling costs are important in monopolistic competition.
Oligopoly Meaning
“Oligopoly” is a term derived from two Greek words “Oligos” meaning a few “pollein” meaning to sell. Thus Oligopoly refers to that form of imperfect competition where there will be only few sellers producing either a homogenous product which are close substitutes but not perfect substitutes or similar products.
There are only few sellers of a product under oligopoly due to which actions taken by any individual seller have a significant impact on other sellers. There is a personalized competition under oligopoly. All firms act as rivals of each other. The most important feature of oligopolistic market is interdependence in decision making.
Features of Oligopoly
– There is only few sellers and large number of buyers.
– Competition amongst the few sellers.
– Blocked entry / threat to entry of new firms.
– Decision of one firm may affect the decision of other firm.
– Selling costs are most important in oligopoly.
(ii) Perfect competition, and price determination.
Though perfect competition is rare, almost a non-existent situation, yet we study price determination under the situation. A perfectly competitive market is one in which the number of buyers and sellers is very large, all engaged in buying and selling a homogeneous product without any artificial restriction and possessing perfect knowledge of a market at a time.
There are two parties which bargain in such a market, the buyers and the sellers. It is only when they agree, a commodity can be bought and sold at a certain price. Thus product pricing is influenced both by buyers and sellers i.e., by demand and supply.
The demand and supply are the two forces, which move in the opposite directions. Price is determined at a point where these two forces are equal, that is known as equilibrium price. In a perfectly competitive market, market demand and market supply determine the equilibrium price.
Equilibrium of a Firm under Perfect Competition
Meaning of Firm’s Equilibrium:
A firm is in equilibrium when it is satisfied with its existing amount of output. A firm in equilibrium has no tendency either to increase or decrease its output. It needs neither expansion nor contraction. It wants to earn maximum profits.
In the words of A.W. Stonier and D.C. Hague, “A firm will be in equilibrium when it is earning maximum money profits.”
Equilibrium of the firm can be analysed in both short-run and long-run periods. A firm can earn the maximum profits in the short run or may incur the minimum loss. But in the long run, it can earn only normal profit.
Equilibrium of the firm can be studied by two approaches:
1) Total Revenue and Total Cost Approach.
2) Marginal Cost and Marginal Revenue Approach.
Total Revenue and Total Cost Approach:
According to this approach, profits are the difference between total revenue and total cost.
Marginal Revenue and Marginal Cost Approach:
This analysis is based on the following assumptions:
a) All firms in an industry use homogeneous factors of production.
b) Their costs are equal. Therefore, all cost curves are uniform.
c) They use homogeneous plants so that their SAC curves are equal.
d) All firms are of equal efficiency.
e) All firms sell their products at the same price determined by demand and supply of the industry so that the price of each firm is equal to AR = MR.
According to this approach, a firm is in equilibrium when two conditions are fulfilled:
a) Marginal Cost should be equal to Marginal Revenue (MC = MR).
b) MC curve cuts MR curve from below.
Determination of Equilibrium of the Firm
Equilibrium of the firm can be analysed in both short-run and long-run periods. A firm can earn the maximum profits in the short run or may incur the minimum loss. But in the long run, it can earn only normal profit.
Short-run Equilibrium of the Firm
The short run is a period of time in which the firm can vary its output by changing the variable factors of production in order to earn maximum profits or to incur minimum losses. The number of firms in the industry is fixed because neither the existing firms can leave nor new firms can enter it. The firm is in equilibrium when it is earning maximum profits as the difference between its total revenue and total cost. A firm is short run equilibrium may face any of the three situations:
1) Super Normal Profits (AR > AC):
A firm is in equilibrium when its marginal cost is equal to marginal revenue and marginal cost curve cuts marginal revenue from below. A firm is in equilibrium earns super normal profit, when average revenue is more than its average cost. It can also be explained with the help of following diagram:
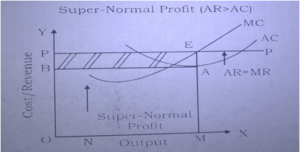
In this figure, output of the firm is shown on OX-axis and cost/revenue on OY-axis. MC is the marginal cost and AC is average cost curve. PP is the average revenue and marginal revenue curve (MR = AR). Supposing OP is the price determined by the industry. At this price, firm’s equilibrium will be at point E, where marginal cost is equal to marginal revenue and marginal cost curve cuts marginal revenue curve from below.
Equilibrium output is OM. At this output AR (price) = EM and AC = AM. Since AR (EM) > AC (AM), firm is earning EA super normal profit per unit of output.
Per Unit super normal profit = EA
Total Super-Normal Profit = EABP
2) Normal Profits (AR = AC):
Normal profits cover just the reward for entrepreneurial services and are included in the cost of production. So that, a firm in equilibrium earns normal profits when its average cost is equal to the average revenue i.e. AC = AR.
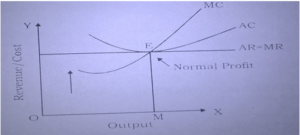
In this figure, output of the firm is shown on OX-axis and cost/revenue on OY-axis. MC is the marginal cost and AC is average cost curve. PP is the average revenue and marginal revenue curve (MR = AR). Supposing OP is the price determined by the industry. At this price, firm’s equilibrium will be at point E, where marginal cost is equal to marginal revenue and marginal cost curve cuts marginal revenue curve from below. The firm earns normal profits at equilibrium output because its average cost and average revenue are equal.
Normal Profits = MC = MR = AC = AR.
3) Minimum Loss (AR < AC)
A firm in equilibrium may incur minimum loss when the average cost is more than the average revenue and average revenue is equal to average variable cost. Even if, the firm discontinues its production, in the short run, it will have to bear the loss of fixed costs. Loss of fixed costs is the minimum loss of the firm.
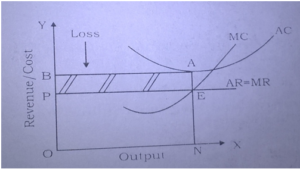
In this figure, output of the firm is shown on OX-axis and cost/revenue on OY-axis. MC is the marginal cost and AC is average cost curve. PP is the average revenue and marginal revenue curve (MR = AR). Supposing OP is the price determined by the industry. At this price, firm’s equilibrium will be at point E, where marginal cost is equal to marginal revenue and marginal cost curve cuts marginal revenue curve from below.
At equilibrium point an (AC) is more than EN (AR). In other words, average cost is more than average revenue by AE which represents per unit loss. As such firm’s total loss is AEPB.
Per Unit Loss = AE
Total Loss = AEPB
From the above discussion, we may conclude from the above discussion that in the short-run each firm may be making either super normal profits, or normal profits or losses depending upon the price of the product.
Long-run Equilibrium of the Firm:
In the long-run, it is possible to make more adjustments than in the short-run. The firm can adjust its plant capacity and scale of operations to the changed circumstances. Therefore, all costs are variable. Firms must earn only normal profits. In case the price is above the long-run AC curve firms will be earning super normal profits.
Attracted by them, new firms will enter the industry and super normal profits will be competed away. If the price is below the LAC curve firms will be incurring losses. As a result, some of the firms will leave the industry so that no firm earns more than normal profits. Thus “in the long-run firms are in equilibrium when they have adjusted their plant so as to produce at the minimum point of their long-run AC curve, which is tangent (at this point) to the demand (AR) curve defined by the market price” so that they earn normal profits.
It’s Assumptions:This analysis is based on the following assumptions:
a) Firms are free to enter into or leave the industry.
b) All firms are of equal efficiency.
c) All factors are homogeneous. They can be obtained at constant and uniform prices.
d) Cost curves of firms are uniform.
e) The plants of firm: are equal having given technology.
f) All firms have perfect knowledge about price and output.
Determination:
Given these assumptions, each firm of the industry will be in the equilibrium in the following two conditions.
(1) In equilibrium, its short-run marginal cost (SMC) must equal to its long-run marginal cost (LMC) as well as its short-run average cost (SAC) and its long-run average cost (LAC) and both should be equal to MR=AR=P. Thus the first equilibrium condition is:
SMC = LMC = MR = AR = P = SAC = LAC at its minimum point, and
(2) LMC curve must cut MR curve from below.
Both these conditions of equilibrium are satisfied at point E in Figure 3 where SMC and LMC curves cut from below SAC and LAC curves at their minimum point E and SMC and LMC curves cut AR = MR curve from below. All curves meet at this point E and the firm produces OQ optimum quantity and sell it at OP price.
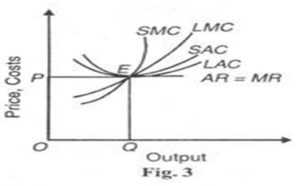
Since we assume equal costs of all the firms of industry, all firms will be in equilibrium m the long-run. At OP price a firm will have neither a tendency to leave nor enter the industry and all firms will earn normal profit.
Rest Available in mobile application
So, Finally you reached the end of the post. Hope you like Economics 318 Free Solved Assignment [TMA] 2022-23. You will solved assignment of other subjects in our page nios solved assignment 202-23. Visit Official website of NIOS for details about assignment.
****